A "Slide insight" is a natural language analysis of a slide that is dynamically generated at runtime using AI. Insights can be added to your slide as text fields or in a tooltip, and they provide your reader with a textual analysis of the content of the slide that changes dynamically as the data in the slide changes. For example, when you use the runtime Chatbot to add new measures to a visual at runtime any insight on that slide will regenerate to reflect your change.
Slide insights are generated in your Application Language and contain analytic information about the content (visuals and applied slicers) that is displayed at runtime.
Note: You can only make use of this functionality if your administrator has selected to Enable Generative AI in the AI Settings page of the Admin Console. Otherwise, the function is not available for use.
Warning: When using LLMs, your assets are generated using public domain algorithms. This can produce erroneous and inconsistent or random results. Use at your own risk.
Slide Insights Content
When you open a slide or tooltip in your presentation at runtime, any Slide Insight variable is replaced with a block of generated text in your Application Language. The text is "analytic," describing the content of the slide that the variable appears on. The generated text reflects all visuals on the slide, even where the content is from different models, and also reflects the current interactive selections. For example, if you have made a selection from a dropdown list, the Slide insights content will reflect that selection.
Slide insights typically generate a few paragraphs of text, although this may depend on your Settings.
What does the insight look like?
The analytic content looks different and is loaded at different times depending on your slide design.
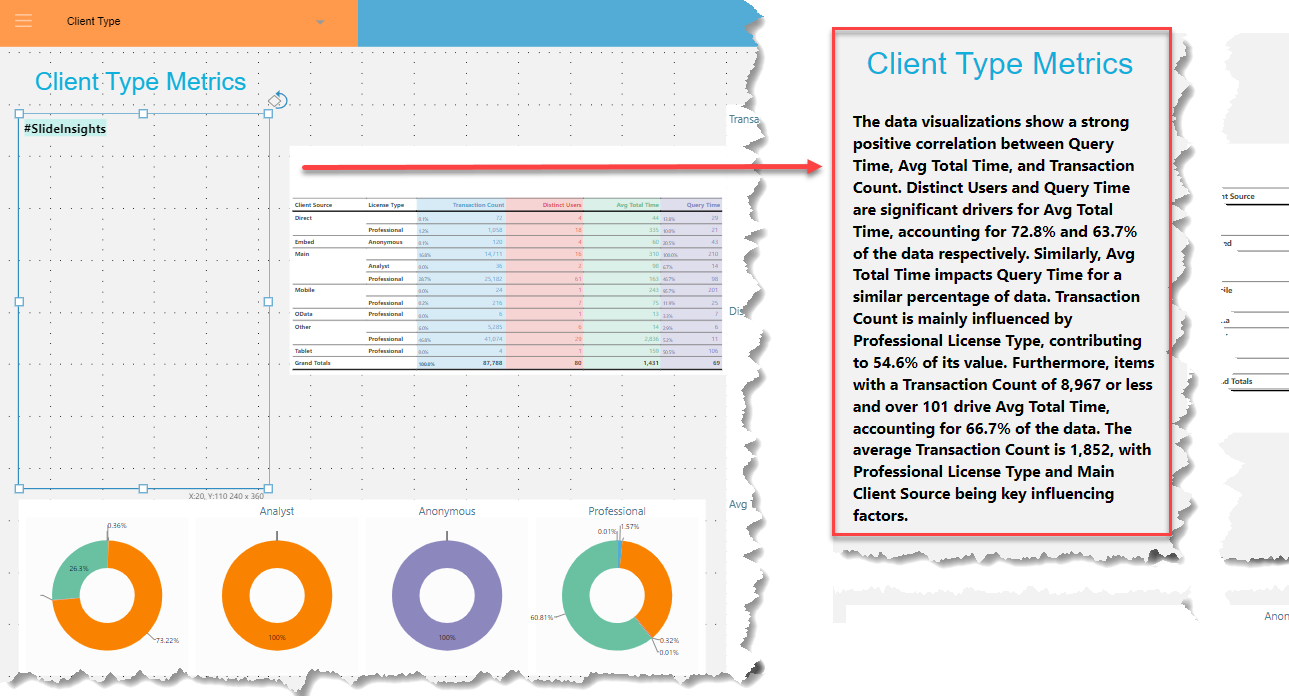
Where the #SlideInsights tag is added as a text field, it is replaced with a generated "textual analysis" at runtime (purple arrow below). This generation happens first when the slide is loaded, and then whenever the content of the slide is updated. For example, changing the value selected on the Country slicer below (orange arrow) affects the content of the slide insights panel as well as affecting the visual and the title of the slide (which includes a dynamic placeholder).
The #SlideInsights tag is not replaced with a generated insight on load; in fact, you cannot see it at all. When your reader views the slide at runtime, they can hover their cursor over the icon (green arrow) to generate and view the Smart insight information in a pop-up. As with the preceding example, the content of the textual analysis reflects the current content of the slide (visuals, slicer selections, and so on).
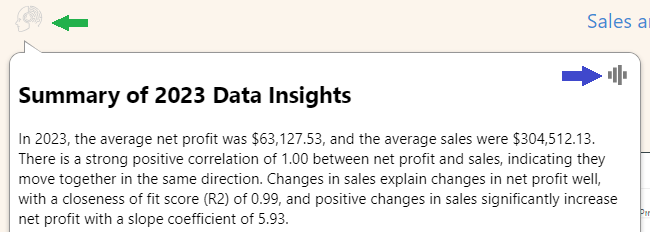
Tip: Your reader can also click the Audio icon (blue arrow) in the pop-up bubble to hear the information in the pop-up read aloud.
Note: Where Slide Insights are added to the slide automatically by the Chatbot (as described below), the Gen-BI illustration is added to the slide at the top-left corner.
What content does the insight contain?
Insights text is "analytic" describing the content of the page, including any applied filters and optionally also incorporating a "fairness analysis." The insights content is typically a paragraph or two, although this may depend on your Settings.
- Click here for more information about Insights content
Adding Insights to your slide
Add insights as a text field
If you add Slide insights as a text field the generated content is created at runtime when the slide is first opened. It is then refreshed whenever runtime changes are made. The advantage of using a text field is that your content is shown to the reader straight away.
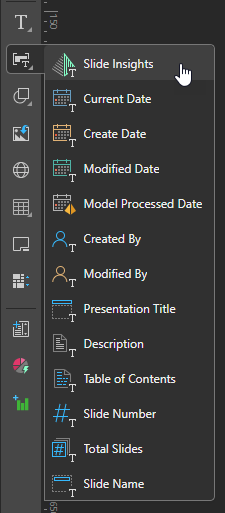
Manual process: From the Toolbox
From the left-hand Toolbox:
- Right-click Add Text Field > Slide Insights.
-
Click the canvas at the point where you would like to add the text field.
- Select the text field on the canvas.
- Optionally, specify the settings for your Slide Insights.
- Click Apply.
 .
.
Clicking creates a standard sized item. Alternatively, you can drag your cursor to draw a box on the canvas indicating the size of the item when dropped.
The Slide Insights panel opens at the bottom of the page.
These options allow you to control the tone type and verbosity used by the LLM when generating the replacement text. For more information, see Settings.
Tip: You should probably resize your text field straight away. This is because the variable #SlideInsights will be replaced with at least a paragraph of text at runtime, so it's important to be sure that you leave enough space for the generated content.
Alternative process: Use the Chatbot
If you include a request to add Slide Insights explicitly to your prompt (you say or type "add insights" as part of your prompt), a Slide Insights text field (a text field containing the variable #SlideInsights) is added to your slide.
- For more information, see Using Advanced Intelligence (NLQ).
Add as a tooltip
If you add Slide insights as a tooltip the Slide insight content is not presented when you view the presentation at runtime, it is generated only when you hover over the asset at runtime. The content of the tooltip can be read out by Pyramid using its text to speech facility.
Tip: You should use a tooltip for your slide insight if you only want to load the insights when you want to view them. This can improve performance, as it means the generation does not have to happen at load time.
Manual process: From the Context Menu
- Drag the asset (a shape, image, or text field) onto your canvas.
- Right-click that asset and select Set Tooltip from the context menu.
- From the Text Fields dropdown list, select Slide Insights (orange arrow below).
- From the Bubble Size option (green arrow above), select Auto.
- Optionally, specify the settings for your Slide Insights in the Settings panel.
- Click Apply to save your settings.
- Click OK to save the details of your tooltip and close the dialog.
This is the asset that you want your user to hover over to open the tooltip. You can drag an asset from the Toolbox or add an Illustration from the Content panel.
The Tooltip Designer dialog opens.
The #SlideInsights tag is added to the tooltip panel and the Slide Settings panel opens at the bottom of the dialog:
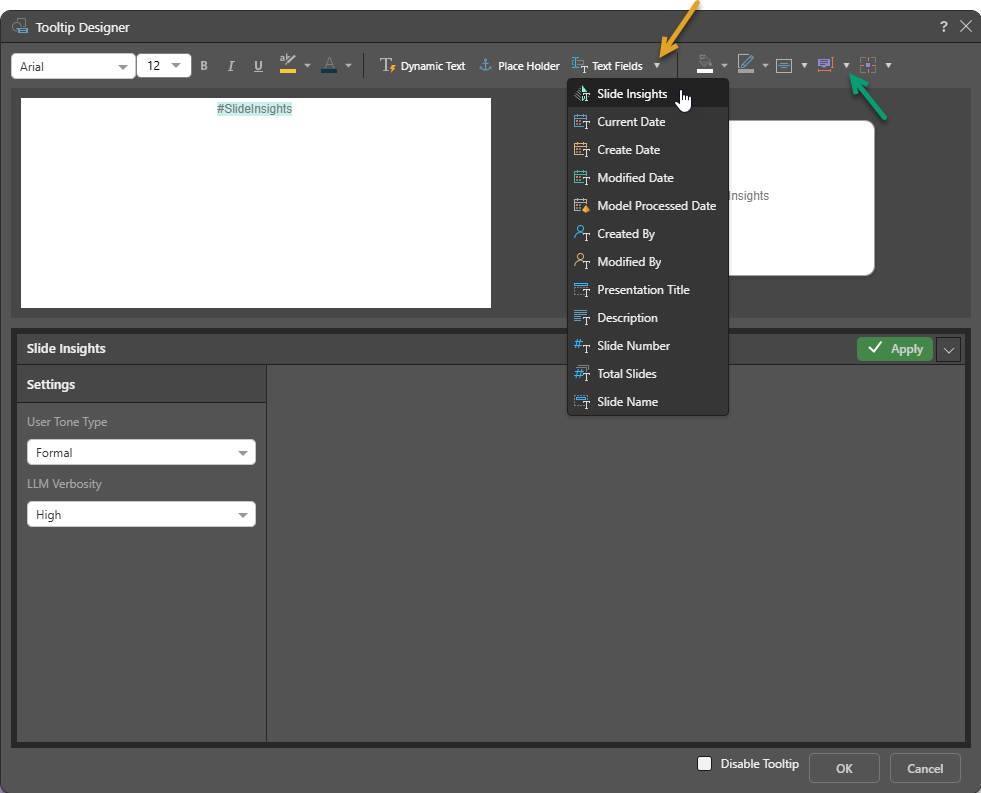
This setting ensures the Smart insights content fits into the tooltip bubble in the runtime presentation.
These options allow you to control the tone type and verbosity used by the LLM when generating the replacement text. For more information, see Settings.
- For more information, see Dynamic Tooltips in Present Pro
Alternative process: Using the Chatbot
If you are using the Chatbot to create your slides and you do not indicate that you want to add Slide Insights explicitly in your prompt, a Gen-BI icon is added to your slide automatically. At runtime, your reader can hover over this icon with their cursor to view the AI generated insight information as a pop-up. Note: This functionality speeds up the load time for the presentation, since the Smart Insights are only populated when the user hovers over the icon.
- Click here to learn to build a presentation using the Chatbot
Editing and Deleting #SlideInsights
You can edit and delete #SlideInsights like any other text field. Be aware that the tag will be replaced with a lot of text when it is rendered at runtime, and plan its appearance and position accordingly.
- Click here for more information about Variable Text Fields
Settings
Open the Settings dialog by clicking the variable on the canvas:
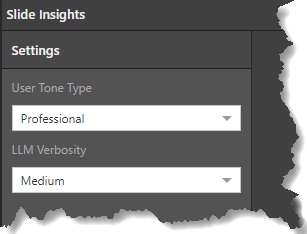
These settings are used by the LLM when generating the Insights:
- User Tone Type: Sets the appropriate tone for the insight message. This can be one of a set of tone values ranging from Professional to Whimsical.
- LLM Verbosity: Sets the level of detail to use for the explanation in the generated insights. This can be one of Low, Medium, or High.
Tip: If you *always* want to select a particular Tone type or Verbosity, you should reset your user defaults to save time in future. For more information, see User Defaults.